

Quetelet and his approach quickly rose to fame, and applications of this novel method started to find their way to the real world. During the US civil war, Abraham Lincoln ordered an extensive study of the Union army soldier’s body sizes, and the averages were used to design uniforms and equipment. This allowed mass production of items that were optimal for the average soldier, which, according to Quetelet, also happened to be the optimal soldier. It wasn’t till the 1950’s that the US army started the realize something was off. With the discovery of the jet-engine, airplanes got much faster, but to the US Airforce’s horror, planes began to crash much more frequently without any technical failures. The root cause was eventually discovered by a researcher named Gilbert S. Daniels. He was the first to realize that the plane’s cockpit, designed for the optimal, average, pilot, wasn’t optimal for any pilot at all and that this suboptimal design led to a fatal slowness while operating the new, faster, planes. The solution was to let go of the focus on averages and embrace the variance in pilots’ body features. Cockpits were redesigned with adjustable components so that each pilot could find a comfortable configuration. The fact that your car seat and desk chair are adjustable today can be traced back to Daniels’ revelation.
A modern US Army body measurement dataset
But what was it precisely that Daniels saw? Why doesn’t the average soldier exist? Let’s take a look at the data and find out! While they abandoned the focus on average values, the US army didn’t stop measuring its soldiers’ body features. And in 2017, they released the ANSUR II dataset, which contains 93 body feature measurements of over 4000 male soldiers.
For simplicity’s sake, let’s focus on just nine features here. When we plot the feature distributions, we can see they all follow normal distributions.
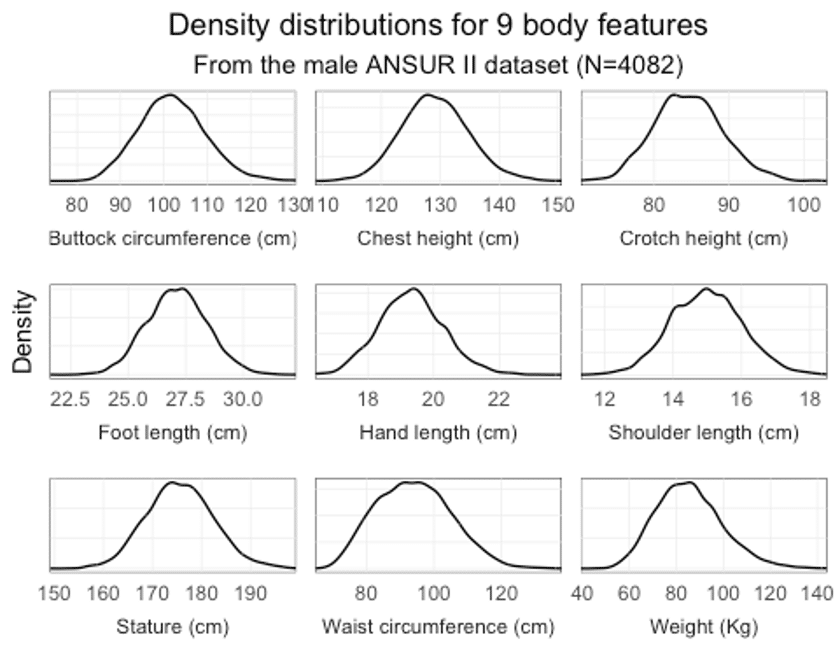
These distributions are pretty symmetrical and tell us that, for each feature, the value that is most frequently measured (the center of the bell curve) is close to the average. Whether we eventually consider a person as ‘average’ for a specific feature depends on how far from the average we allow them to deviate.
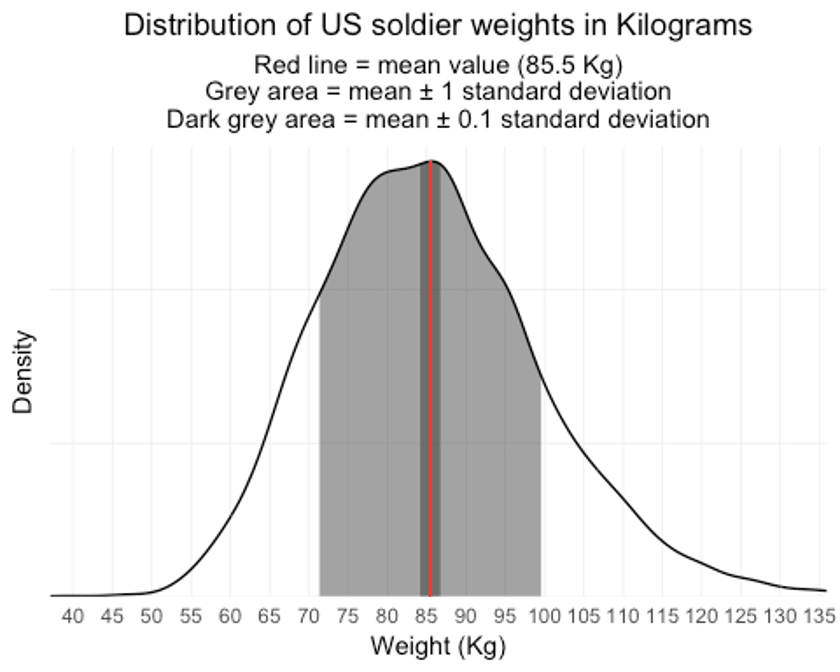
Let’s illustrate this for a single feature, body weight.
How average is average?
On average, male US soldiers weigh 85.5 Kg. We could say that all soldiers that deviate less than one standard deviation (14 Kg) from this value are ‘somewhat average’ for body weight, this would be true for 69% of soldiers. The wide, gray area in the plot shows you the weights that fall within this ‘somewhat average’ range. I have a gut feeling that Adolphe Quetelet wouldn’t be all too satisfied with a lot of these ‘somewhat average’ soldiers since most of them have weights quite far from the ‘true’ average value, so a second range was added (dark grey area) with a standard deviation of 0.1. Only 8% of soldiers fall within this range and can be considered ‘super average’ in terms of weight.
We could repeat this procedure for each feature in the dataset, and we’d always find that about 69% fall within the ‘somewhat average’ range and 8% in the ‘super average’ range. This is a property of the normal distribution the data follows.
The assumption that the army designers made was that the 8% super average soldiers are the same for each feature. They are the perfect soldiers in Quetelet’s vision.
Finding perfectly average soldiers
Let’s validate this assumption in the data. We’ll check how many soldiers fall within the wide and narrow range of averageness for multiple features.

It turns out the 69% of soldiers that are somewhat average for one feature aren’t all the same soldiers that are somewhat average for other features. If we consider nine features, less than 20% of soldiers are somewhat average for all of them. For the stricter group of ‘super average’ soldiers, the results are even more spectacular. Not a single soldier is ‘super average’ for all of the first three features! This is how Gilbert Daniels discovered the average soldier doesn’t exist and that designing equipment for this Platonic ideal is a bad practice.
Conclusion
While simple in nature, averages are tricky and deceptive when misused, the variance in your data is a treasure!
Sources
A more detailed version of the story behind this blog post can be found in this excellent podcast and the book The End of Average by Todd Rose.
